Last updated on November 30th, 2024 at 08:10 pm
Elliott Wave Theory is a powerful tool for market analysis, widely recognized for its significance in predicting financial markets. This theory, developed by Ralph Nelson Elliott, offers valuable insights into market behaviors and trends, making it particularly useful in forex and stock trading. By understanding the patterns and cycles identified in the Elliott Wave principle, traders can effectively forecast market trends and potential reversals. This analytical approach enables traders to make informed decisions and strategically navigate the complexities of the financial markets, leveraging the predictive power of Elliott Wave Theory.
What is Elliott Wave Theory?
Elliott Wave Theory, developed by Ralph Nelson Elliott in the 1930s, is a foundational concept in technical analysis used to predict market trends. This theory is based on the idea that financial markets move in repetitive patterns, which are influenced by the underlying sentiment and behavior of market participants. Elliott observed that these patterns, or “waves,” repeat themselves in predictable cycles, driven by the collective psychology of traders.
The theory implies that market prices unfold in specific patterns known as Elliott Waves, which are divided into two main categories: impulse waves and corrective waves. Impulse waves move in the direction of the main trend, consisting of five waves (three motive waves and two corrective waves), while corrective waves move against the main trend and are made up of three waves (two corrective waves and one motive wave).
At the core of Elliott Wave Theory is the Elliott Wave principle, which asserts that market movements are not random but follow these identifiable wave patterns. Traders use this principle to analyze market cycles, forecast potential price movements, and make informed trading decisions. By recognizing these wave patterns, traders can better predict market trends and potential reversals, enhancing their ability to navigate financial markets effectively.
How Does the Elliott Wave Principle Work?
1. Impulse Waves
Impulse waves are the main driving force in the direction of the overall market trend. They consist of five waves: three upward waves (motive waves) and two downward waves (corrective waves). The structure of impulse waves is always in a 5-3-5-3-5 pattern.
2. Characteristics of Impulse Waves:
- Wave 1: The initial move in the trend direction.
- Wave 2: A correction, retracing a portion of Wave 1.
- Wave 3: The strongest and longest wave, extending the trend further.
- Wave 4: Another correction, typically less severe than Wave 2.
- Wave 5: The final move in the trend direction, often driven by speculative enthusiasm.
3. Corrective Waves
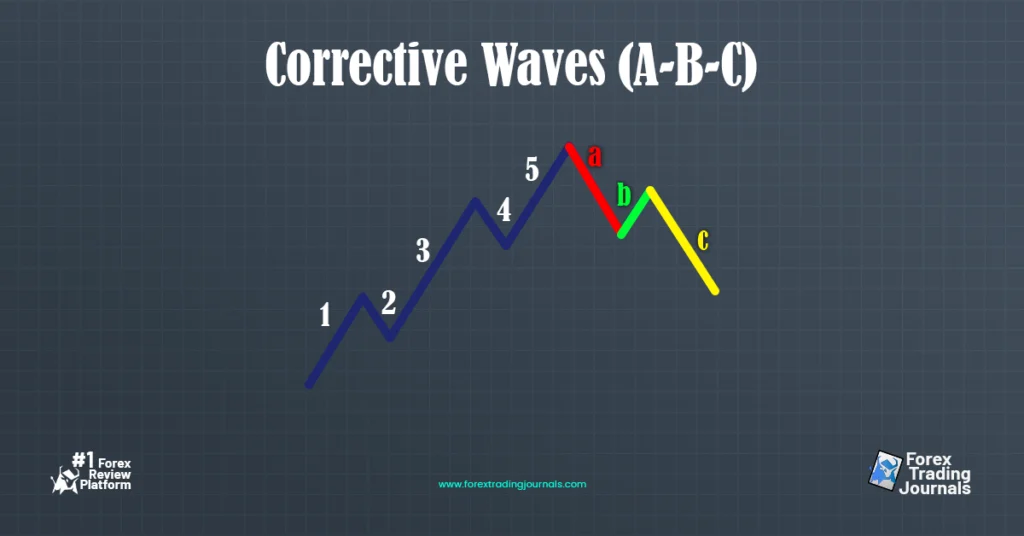
Corrective waves move against the overall market trend and consist of three waves: two corrective waves and one motive wave. These waves are labeled A, B, and C.
4. Characteristics of Corrective Waves:
- Wave A: The initial move against the trend.
- Wave B: A retracement that partially offsets Wave A.
- Wave C: A continuation of the move against the trend, usually equal in length to Wave A.
5. Practical Applications in Elliott Wave Trading Strategies
Traders utilize the Elliott Wave principle to identify potential entry and exit points in the market. By recognizing the wave patterns, traders can predict market trends and reversals, making informed decisions about when to buy or sell. The key is to identify the end of corrective waves and the beginning of impulse waves to align trades with the main market trend.
Examples of Applications:
- Identifying Trends: By observing the development of impulse and corrective waves, traders can determine the direction of the prevailing market trend.
- Predicting Reversals: The completion of a five-wave impulse pattern often signals a potential reversal, prompting traders to adjust their positions.
- Setting Targets: Traders can use wave patterns to set profit targets and stop-loss levels, optimizing their risk-reward ratio.
6. Visual Explanation of Impulse and Corrective Waves
A diagram illustrating the Elliott Wave principle can help visually explain the concept. Here’s a basic representation:
Impulse Waves (5-3-5-3-5)

Corrective Waves (A-B-C)

The Role of Fibonacci in Elliott Wave Analysis
Elliott Wave Fibonacci is an essential component in the toolbox of any trader who applies Elliott Wave Theory to their market analysis. By integrating Fibonacci retracement and extension levels, traders can identify crucial price levels where waves are likely to end, providing valuable insights into potential market reversals or continuations.
Fibonacci Retracement and Extension Levels
Fibonacci retracement levels are horizontal lines that indicate where support and resistance are likely to occur. They are derived from the Fibonacci sequence and commonly used ratios include 38.2%, 50%, and 61.8%. These levels help traders predict the end of corrective waves, offering key entry and exit points.
On the other hand, Fibonacci extension levels are used to forecast the potential end of impulse waves. These levels, such as 161.8% and 261.8%, help traders project the future price movements during the continuation of the trend.
Using Fibonacci Ratios to Project Price Movements
Here’s how traders can use Fibonacci ratios to apply Elliott Wave Fibonacci in their trading strategies:
- Identify the Start and End Points:
- Begin by identifying the start and end points of an impulse wave.
- For retracements, select the high and low points of the wave.
- Apply Fibonacci Retracement Levels:
- Draw the Fibonacci retracement tool from the low to the high point of the impulse wave for an uptrend, or from the high to the low point for a downtrend.
- Observe the retracement levels (38.2%, 50%, 61.8%) to identify potential support or resistance areas where the corrective wave may end.
- Analyze the Corrective Wave:
- If the price retraces to one of the Fibonacci levels and shows signs of reversing, it could indicate the end of the corrective wave and the resumption of the impulse wave.
- Apply Fibonacci Extension Levels:
- For projecting the continuation of the impulse wave, draw the Fibonacci extension tool from the beginning of the impulse wave to the end, and then back to the retracement level.
- The extension levels (161.8%, 261.8%) provide potential target levels for the completion of the next impulse wave.
Elliott Waves Trading Strategies for Beginners and Pros
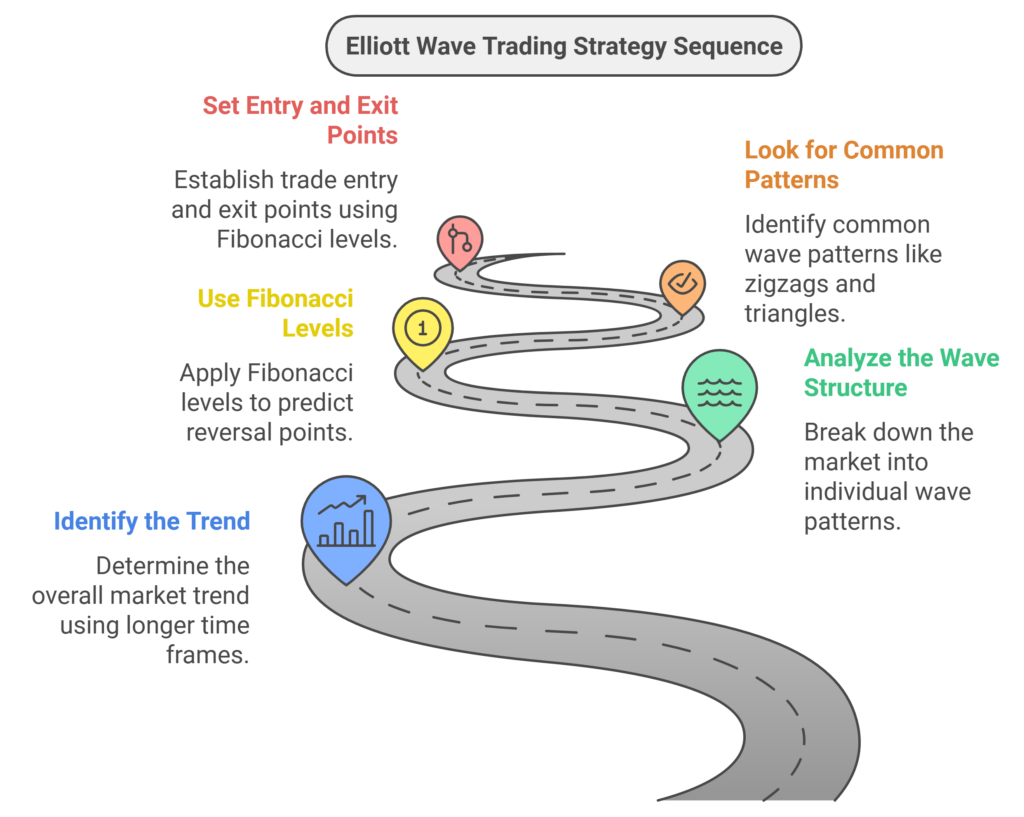
Elliott Wave Theory is an essential tool for traders of all experience levels looking to predict market trends and make informed trading decisions. Here’s a step-by-step guide on how to implement Elliott waves trading into your technical analysis, including common patterns, mistakes to avoid, and practical applications.
Step-by-Step Guidance for Implementing Elliott Waves Trading

- Identify the Trend:
- Begin by determining the overall market trend using longer time frames (daily, weekly charts). Look for clear impulse and corrective wave patterns.
- Use tools like moving averages and trendlines to help identify the main trend direction.
- Analyze the Wave Structure:
- Break down the market into its individual wave patterns. Identify the five-wave impulse pattern and the three-wave corrective pattern.
- Use charting software to mark each wave and keep track of the pattern development.
- Use Fibonacci Levels:
- Apply Fibonacci retracement and extension levels to predict potential reversal points and set target levels.
- For corrective waves, look for retracement levels at 38.2%, 50%, and 61.8%. For impulse waves, use extension levels like 161.8% and 261.8%.
- Look for Common Patterns:
- Zigzags: Sharp and deep corrective waves that typically occur in a 5-3-5 structure.
- Flats: Sideways corrective waves in a 3-3-5 structure, indicating a consolidation phase.
- Triangles: Five-wave corrective patterns (A-B-C-D-E) indicating a market in consolidation before the next impulse wave.
- Set Entry and Exit Points:
- Enter trades at the beginning of an impulse wave after a corrective wave ends.
- Use stop-loss orders below the end of the corrective wave to manage risk.
- Set profit targets using Fibonacci extension levels and previous support/resistance levels.
Common Patterns in Elliott Wave Theory
- Zigzags: Characterized by sharp, fast movements and deep corrections, often seen in volatile markets. Zigzags typically follow a 5-3-5 wave structure and provide good opportunities for quick trades.
- Flats: These patterns indicate a period of market consolidation and usually follow a 3-3-5 wave structure. Flats are useful for identifying potential breakout points.
- Triangles: Five-wave patterns (A-B-C-D-E) that signal indecision in the market. Triangles often precede significant market moves and provide excellent trading opportunities once the pattern completes.
Common Mistakes and How to Avoid Them
- Misidentifying Waves: One of the most common mistakes is mislabeling wave patterns. Ensure you follow the rules of wave structure and use tools like Fibonacci levels for confirmation.
- Overtrading: Trying to trade every wave can lead to overtrading. Focus on high-probability setups and wait for clear patterns to emerge.
- Ignoring the Larger Trend: Always consider the larger market trend. Trading against the main trend can increase the risk of losses.
Backtesting Examples
Backtesting is crucial for validating your Elliott Wave trading strategies. By applying Elliott Wave Theory to historical market data, you can identify potential market reversals and refine your approach.
Example 1:
- Identify an impulse wave followed by a corrective wave in historical data.
- Apply Fibonacci retracement levels to see how accurately they predict reversal points.
- Analyze the subsequent price movement to determine if the predicted impulse wave occurred.
Example 2:
- Look for common patterns like Zigzags, Flats, and Triangles in past price charts.
- Use these patterns to set hypothetical entry and exit points.
- Assess the success rate of these trades to adjust your strategy accordingly.
Elliott Waves Trading in Forex and Stock Markets
Elliott Wave Theory is a crucial strategy for both forex and stock markets. It helps traders identify market trends, predict potential reversals, and set strategic entry and exit points. Whether you’re trading currency pairs or equities, understanding and applying Elliott Wave principles can significantly enhance your market analysis and trading performance.
Elliott Wave Theory and Market Psychology
How Market Sentiment Drives Elliott Waves
Elliott Wave Theory is deeply rooted in market psychology, reflecting the collective sentiment of market participants. This theory suggests that the patterns observed in market price movements are driven by the fluctuating emotions and sentiments of traders. Understanding these psychological underpinnings can provide valuable insights into market trends and potential reversals.
Collective Human Sentiment and Elliott Waves
At its core, Elliott Wave Theory is based on the idea that financial markets move in repetitive cycles, driven by the collective behavior of investors. These cycles consist of waves that reflect the underlying market sentiment:
- Impulse Waves: Represent periods of strong market confidence and direction. These five-wave patterns indicate a prevailing trend, whether bullish or bearish.
- Corrective Waves: Occur when the market experiences a pause or pullback, often driven by uncertainty or profit-taking. These three-wave patterns move against the main trend.
Assessing Market Phases with Elliott Waves
Traders can use Elliott waves to gauge the overall market sentiment and determine whether the market is in a bullish, bearish, or corrective phase:
- Bullish Phase: Identified by a series of upward impulse waves (1, 3, 5) and smaller corrective waves (2, 4). This indicates strong positive sentiment and buying pressure.
- Bearish Phase: Characterized by downward impulse waves (1, 3, 5) and upward corrective waves (2, 4). This reflects negative sentiment and selling pressure.
- Corrective Phase: Marked by a three-wave (A-B-C) pattern that moves against the main trend. This phase often signals consolidation or a potential reversal point.
Real-World Examples of Market Psychology and Elliott Waves
The alignment of market psychology with Elliott waves can be seen in various historical events:
Economic Crises:
- 2008 Financial Crisis: During the crisis, the stock market exhibited clear Elliott wave patterns. The panic and negative sentiment drove sharp downward impulse waves, followed by brief corrective phases as the market attempted to stabilize. Traders who identified these patterns could better anticipate the market’s movements during this volatile period.
Market Rallies:
- Post-COVID-19 Rally: Following the initial crash in early 2020 due to the COVID-19 pandemic, markets experienced a significant rally. This rally followed an Elliott wave pattern with strong upward impulse waves reflecting renewed investor confidence and positive sentiment as governments implemented stimulus measures and vaccination efforts began.
Common Mistakes When Using Elliott Wave Theory
Avoid These Mistakes When Using Elliott Waves
Elliott Wave Theory is a powerful tool, but it can be challenging to master. Traders often make several common mistakes when applying this theory to their market analysis. Here are some of the key pitfalls to avoid and actionable tips to help you improve your wave counts and identify patterns accurately.
Common Mistakes Traders Make
- Misidentifying Waves:
- Mistake: Traders often mislabel waves, leading to incorrect predictions.
- Tip: Always follow the rules of wave structure and look for clear patterns before labeling waves. Practice with historical data to improve your accuracy.
- Ignoring the Larger Trend:
- Mistake: Focusing too much on small wave patterns without considering the overall market trend.
- Tip: Use longer time frames (daily or weekly charts) to identify the primary trend. Align your wave counts with the larger trend to ensure consistency.
- Overtrading:
- Mistake: Trying to trade every wave, leading to overtrading and increased risk.
- Tip: Focus on high-probability setups and wait for clear wave patterns to emerge. Be selective and patient with your trades.
- Neglecting Confirmation Tools:
- Mistake: Relying solely on Elliott Wave Theory without using additional confirmation tools.
- Tip: Use tools like Fibonacci retracements, moving averages, and trendlines to confirm your wave counts and improve accuracy.
- Emotional Trading:
- Mistake: Allowing emotions to influence trading decisions, leading to impulsive actions.
- Tip: Stick to your trading plan and use objective criteria for entering and exiting trades. Keep a trading journal to track your decisions and learn from your experiences.
Actionable Tips to Improve Wave Counts
- Practice with Historical Data:
- Review historical price charts and practice identifying wave patterns. This will help you become more familiar with the structure and improve your accuracy over time.
- Use Multiple Time Frames:
- Analyze multiple time frames to get a comprehensive view of the market. This helps you align your wave counts with the overall trend and avoid misinterpretations.
- Validate with Fibonacci Levels:
- Apply Fibonacci retracement and extension levels to validate your wave counts. These levels can provide key support and resistance points, helping you identify potential wave endings.
- Stay Updated with Market News:
- Keep abreast of economic news and events that could impact market sentiment. Understanding the broader context can help you make more informed decisions when applying Elliott Wave Theory.
- Learn from Experts:
- Study the work of experienced Elliott Wave practitioners and analysts. Reading books, attending webinars, and participating in trading communities can provide valuable insights and enhance your skills.
Using Fibonacci Retracements for Confirmation
Fibonacci retracements are an excellent tool to confirm your Elliott wave counts. Here’s how to use them effectively:
- Identify the Start and End Points:
- Select the high and low points of the impulse wave to draw Fibonacci retracement levels.
- Apply the Retracement Tool:
- Use the retracement tool on your charting software to draw the levels.
- Look for Confluence:
- Check if the retracement levels align with your wave counts. Levels like 38.2%, 50%, and 61.8% are key areas to watch for potential support or resistance.
- Adjust Your Analysis:
- If the price respects these levels and shows signs of reversing, it adds confidence to your wave count. Adjust your analysis as needed based on this confirmation.
By avoiding these common mistakes and following these tips, traders can improve their application of Elliott Wave Theory, making more accurate predictions and better trading decisions. Remember, practice and continuous learning are key to mastering this powerful analytical tool.
Conclusion
Mastering Elliott Wave Theory is crucial for both short-term and long-term trading strategies. This analytical tool helps traders identify market trends, predict reversals, and make informed decisions by understanding market psychology and sentiment. Practicing wave counting and applying Fibonacci retracement and extension levels are essential for improving market predictions. Continuous learning and practice are key to becoming proficient in Elliott Wave Theory.


